


S7 Sciences
🇺🇸⌄
21+

Restricted research comparison

Before entering S7 Sciences

Please confirm both statements below. Access is limited to adults who understand the strict research-use restriction applied to the third-party product listings compared on this site.

Required confirmations
I cannot confirm — exit site

Important safety information: S7 Sciences is an affiliate comparison site, not a seller or medical provider. Linked products are not intended for injection or other administration. Please review the complete Terms of Use.

Independent affiliate comparison · Research use only · Not medical advice
S7 SciencesS7 Sciences
ProductsOffersCalculatorCOAResourcesSocial MediaAboutContactAffiliatesInternational Vendors
Comparison Cart0
Comparison cart
0 items

No products added yet.

Open full comparison cart
🇺🇸⌄

The selected language applies across the complete S7 Sciences site. Exact product names, vendor names, strengths, prices, coupon codes, source titles, authors, quotations, and destination links remain unchanged.

ProductsOffersCalculatorCOAResourcesSocial MediaAboutContactAffiliatesInternational Vendors
🇺🇸⌄
Resources/Featured article

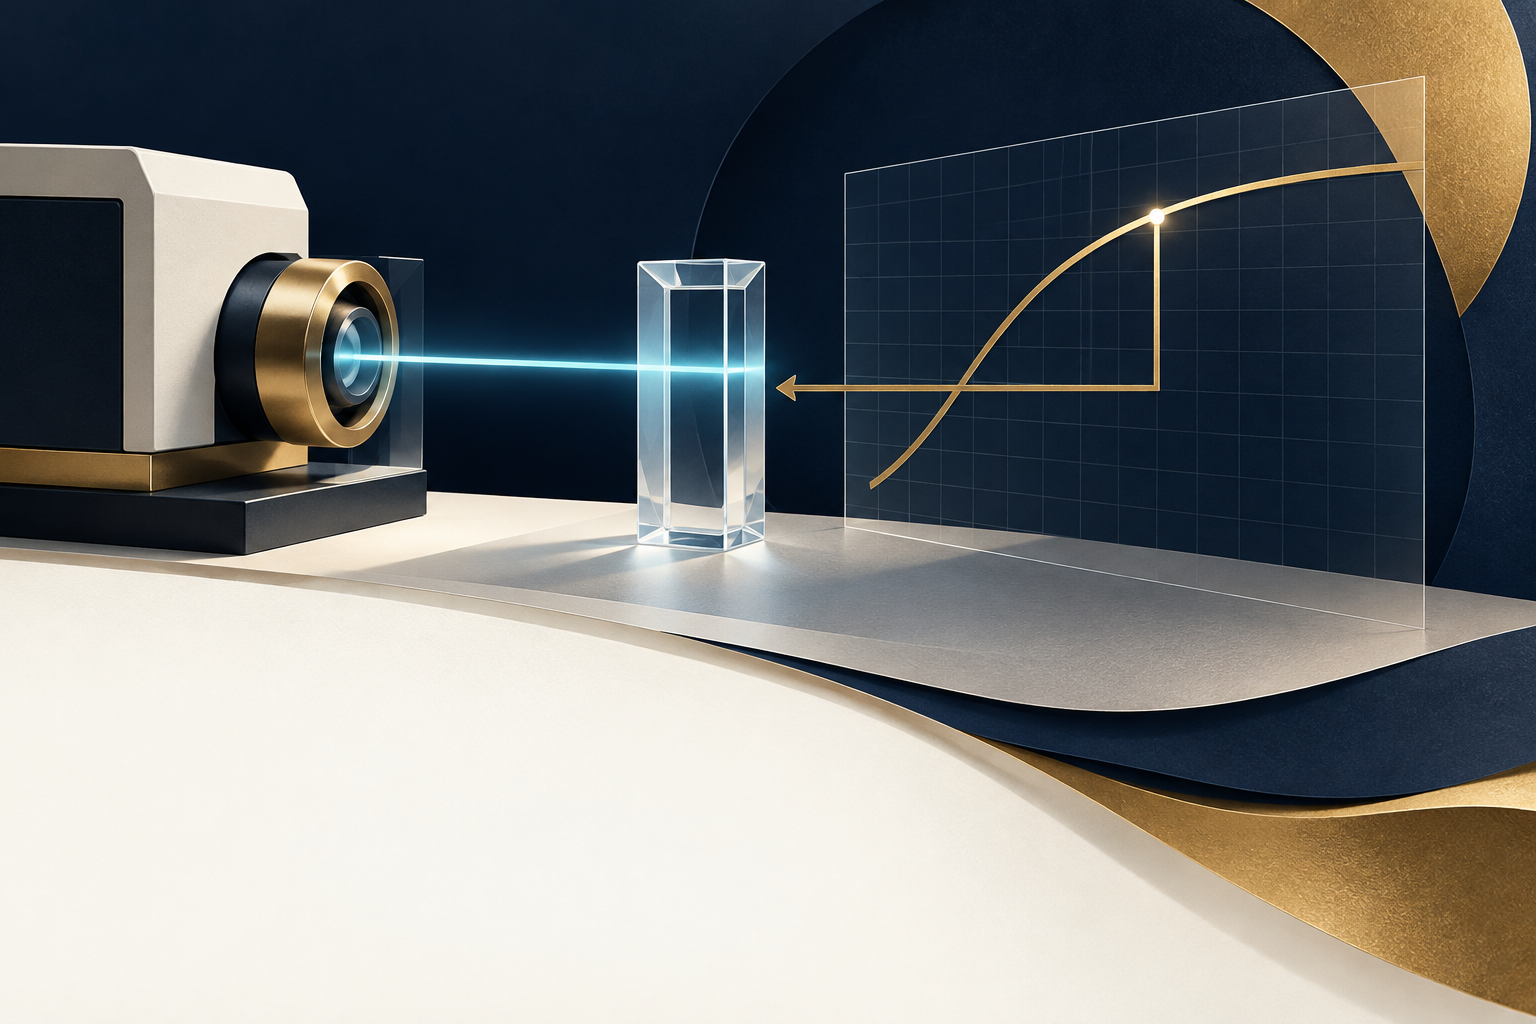
NIST’s calibration method explains why a measured signal cannot simply be relabeled as concentration.

By S7 Sciences Research DeskUpdated October 14, 20262 min read
S7 Sciences
The short version

Convert a signal with the appropriate calibration relationship, preserving its offset, scale and units.

Featured original sourceS7 adaptation and commentary

Calibration of future measurements

Institutional authors: NIST and SEMATECH

NIST/SEMATECH e-Handbook of Statistical Methods, section 2.3.6.6 · Undated handbook section; reviewed October 14, 2026

“inverse of the calibration curve”

The article below is an original S7 Sciences summary and analysis. The quoted passage is brief and attributed; the complete original remains with its author and publisher.

Read the complete original source

The direction of the calculation matters

The NIST/SEMATECH handbook describes how a calibration curve converts a future instrument reading into a calibrated value. In the linear case, first subtract the estimated offset from the signal, then divide by the estimated slope. The calculation runs backward through the fitted relationship because the measurement supplies the signal and the unknown is the quantity of interest.

An example without laboratory instructions

Consider an invented, unitless teaching relationship: signal = 2 + 3 × quantity. A signal of 17 corresponds to quantity (17 − 2) ÷ 3 = 5. Dividing 17 by 3 alone gives about 5.67 because it ignores the offset. Subtracting 2 alone gives 15 because it ignores the scale. These numbers illustrate algebra only; they are not measurements, concentrations or a preparation recipe.

What to keep beside a reported concentration

A calculation is easier to evaluate when the report identifies the signal, the calibrated quantity and the relationship connecting them. Units belong to those definitions. Do not assume that a value reported by an instrument is already the final concentration, or silently treat an offset as zero because the resulting arithmetic is simpler.

A formula still has conditions

NIST notes that calibration depends on the instrument remaining in statistical control, and that chemical measurements often use a fresh curve for each batch. Its page also treats nonlinear relationships separately. Our small linear example cannot establish that a particular laboratory’s method is valid. The official page is undated; it was reviewed October 14, 2026, rather than presented as a new publication.

Evidence summary, not treatment guidance

This article is educational and does not contain medical advice, dosing, administration, or cycling instructions. Research-use-only products are not intended for human or veterinary use.

Primary and authoritative sources

Read the evidence behind this article.

Calibration of future measurementsInstitutional authors: NIST and SEMATECHNIST/SEMATECH e-Handbook of Statistical Methods, section 2.3.6.6

Complete official method page reviewed, including linear inverse, statistical-control condition and nonlinear models. The unitless numerical example is original S7 teaching material.

Back to weekly resources
S7 Sciences

An independent price and documentation index for research peptide listings from third-party vendors.

A Sunset 7 Company
@s7sciences on Instagram

Navigate

ProductsOffersComparison CartConcentration CalculatorCOAResourcesSocial MediaAboutContactAffiliatesInternational Vendors

Information

FAQTermsPrivacyDocumentationVendor & Lab LocationsLocal Pickup · By Appointmentsupport@s7sciences.com

Legal and research-use notice

S7 Sciences does not manufacture, sell, process payment for, or fulfill the linked products. Purchases are completed directly with independent third-party vendors under their own terms and policies.

S7 Sciences may earn a commission from purchases made through clearly labeled links. Vendor prices and documents can change; verify the final listing, lot, COA, shipping, and terms before purchasing.

As an Amazon Associate I earn from qualifying purchases.

Linked materials are presented for laboratory research reference only—not human or veterinary use. This site does not provide medical advice. Please consult a licensed physician before considering or beginning a medical-grade peptide program. Nothing here is dosing guidance or a statement of safety, efficacy, or sterility.

© 2026 S7 SciencesAffiliate relationships disclosed · Prices checked October 4, 2026