
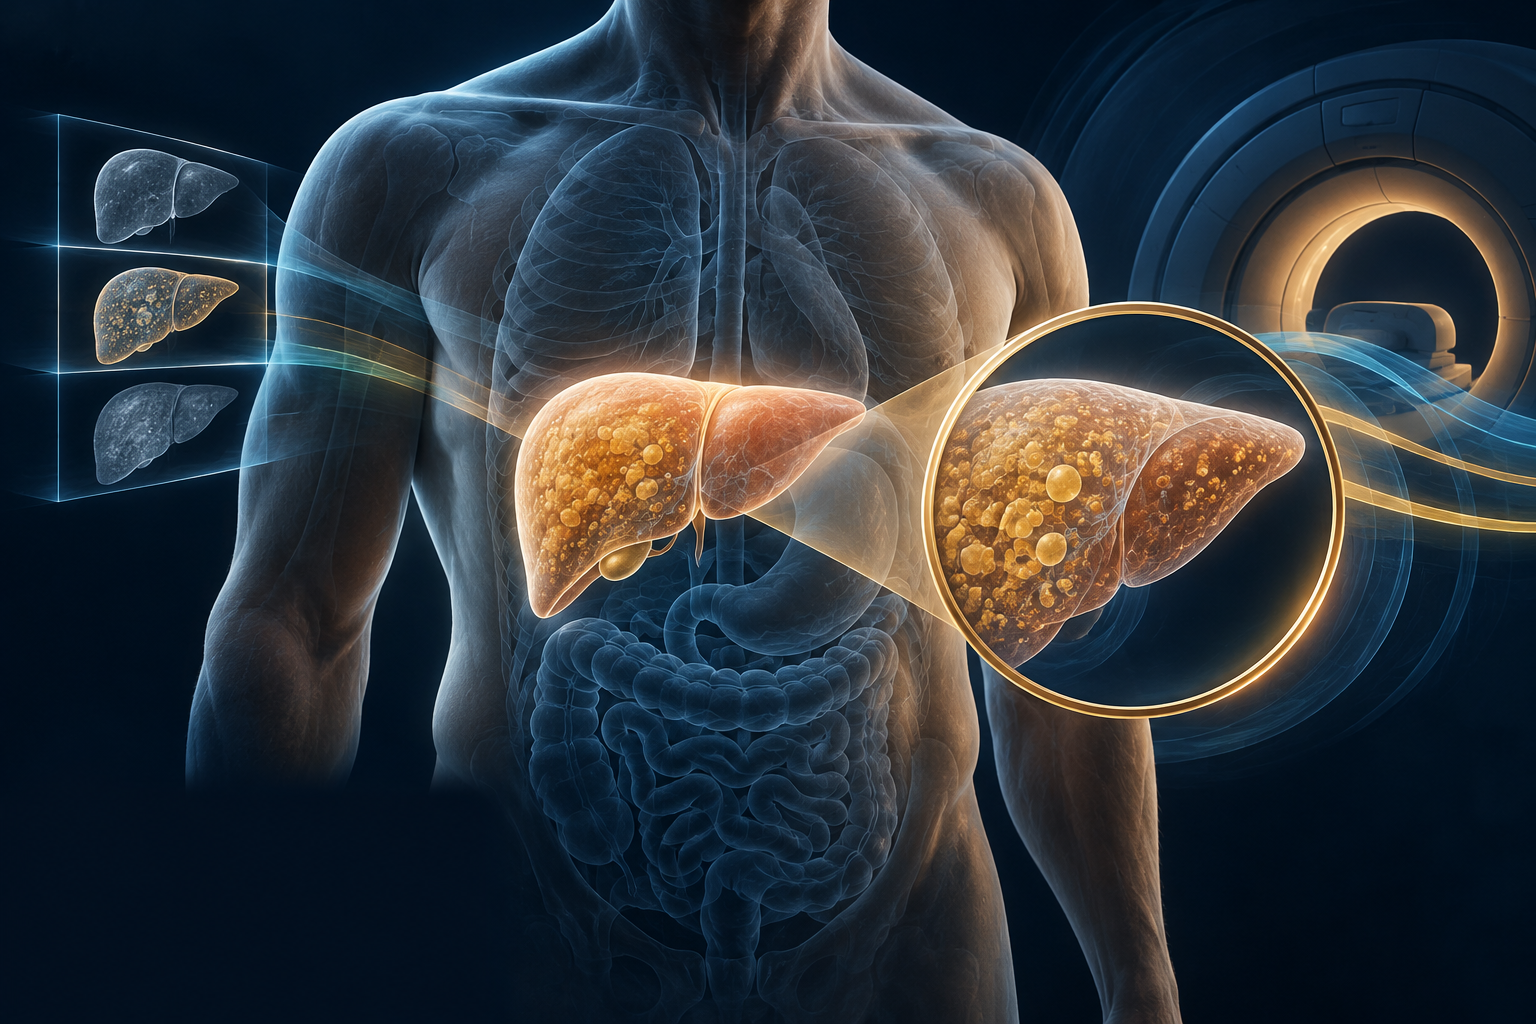

Start with the population and the measurement
Stanley and colleagues randomized 61 adults with HIV and non-alcoholic fatty liver disease to tesamorelin or placebo for 12 months. The double-blind trial included 48 men and 13 women; it was not a study of otherwise healthy men seeking a physique change. Its main endpoint was liver fat measured by magnetic resonance spectroscopy.
The between-group effect was a 4.1-percentage-point reduction in hepatic fat fraction, corresponding to a 37% relative reduction. That is not a 37% reduction in body weight. More participants receiving tesamorelin reached a liver-fat fraction below 5%. These results concern a selected clinical population and a specific measurement, not proven prevention of cirrhosis or a general bodybuilding benefit.
Two questions to put beside a percentage
S7’s reading approach is to identify the denominator first: percentage of what? Then name the comparison: change from baseline, difference from placebo, or proportion of participants crossing a threshold? Those statements can all sound impressive while describing different things. Write each in its own sentence before comparing headlines.
A useful next question is whether the outcome described is the outcome you actually want to understand. An imaging result should stay an imaging result until evidence connects it to a meaningful clinical benefit. The same discipline helps when an article shifts from a narrowly defined study group to a broad audience.
Read the study, not a product promise
This is an educational discussion of published research, not a treatment recommendation. It does not establish that a vendor’s research vial matches a clinical study product. The accompanying illustration is conceptual artwork, not a participant scan or before-and-after result.